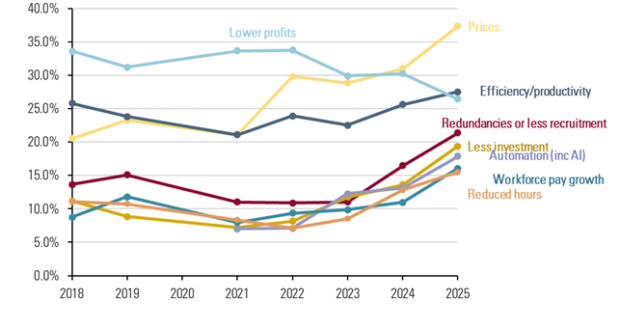
In most cases, businesses will adapt via a mixture of these, and other, approaches. But price increases are consistently one of the main ways firms tell us they’re dealing with minimum wage increases. Given all of this, it is natural to wonder how much the minimum wage contributes to inflation.
Price increases have become a more common reported response in recent years. But while this gives us an idea of how many businesses adjust their prices following a minimum wage increase, it doesn’t tell us the extent of those price increases, or what difference they make to the overall inflation rate.
Figure: Responses to NLW increases, CIPD summer Labour Market Outlook 2018-2025
At the Low Pay Commission, we estimate this effect. Our estimates suggest that the minimum wage’s impact on the economy-wide wage bill and prices is minimal.
Although many businesses say they respond to minimum wage increases by putting up their prices, our estimates suggest that, in aggregate, the minimum wage only makes a small contribution to overall inflation. This is because:
- Pay for workers who benefit from minimum wage increases only makes up a small fraction of the overall wage bill. (Low-paid workers are, by definition, paid less than other workers, and are more likely to work part-time.)
- Even if the minimum wage didn’t increase, low-paid workers would likely still receive a pay rise.
- Increases in the pay bill are only one factor which contributes to overall inflation. Other factors include the cost of imports, and, for goods made in the UK, input costs like energy, raw materials and rent.
The detailed version
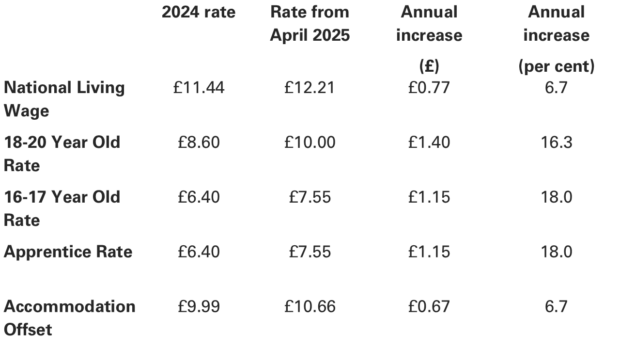
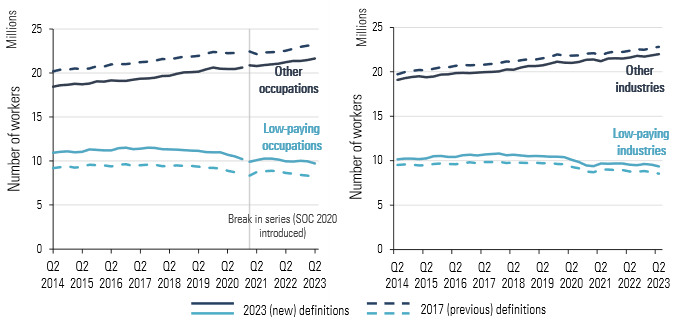
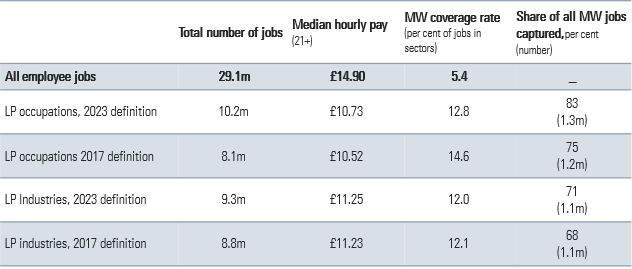
Minimum wage jobs only account for a small share of the economy-wide wage bill. In April 2025 around 6 per cent of jobs were paid the National Living Wage (NLW), but these jobs only accounted for 2.5 per cent of the total weekly wage bill. This is because minimum wage workers are by definition the lowest-paid in the economy and are more likely to be working part-time than those in higher-paid jobs.
On the other hand, minimum wage workers, are not the only ones to benefit from minimum wage increases. “Spillover effects” mean that some workers paid above the minimum wage also receive larger pay rises than they otherwise would (i.e., if the minimum wage hadn’t increased). This happens because employers need to keep a pay differential between the minimum wage and other jobs requiring more skills, experience or seniority. When the wage floor goes up, there is upward pressure on the wages of the supervisors or team leaders of minimum wage workers.
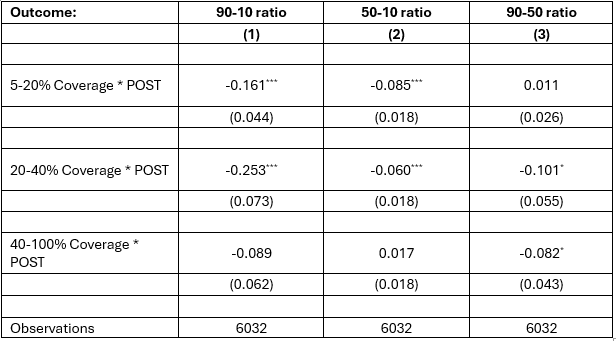
We estimate that the minimum wage has spillover effects up to the 35th percentile of the hourly wage distribution – that is, people who were paid up to £15.17/hour in April 2025. Even if we include all the workers caught by these spillover effects, we estimate that the NLW influences less than a fifth of the economy-wide wage bill.
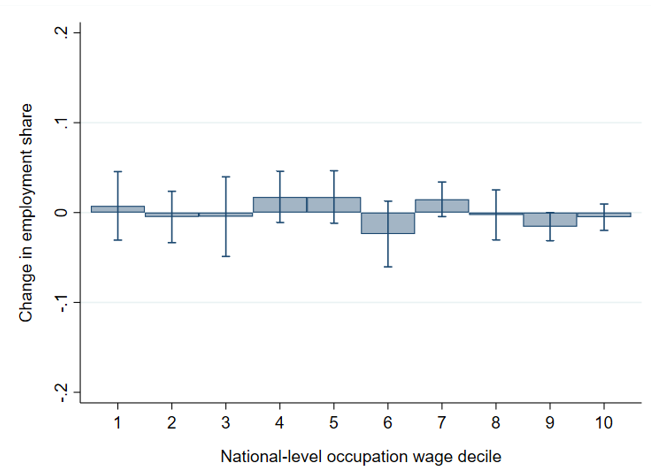
Figure: Annual change in hourly pay by percentile, April 2025, 21 and over
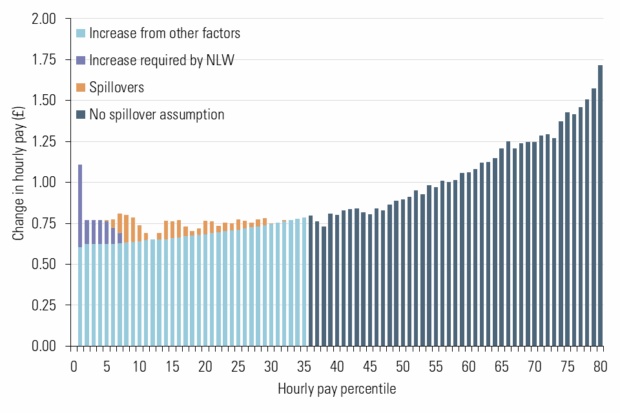
In April 2025, the NLW rose by 6.7 per cent. Workers directly and indirectly affected by the NLW received an average pay rise of 6 per cent. This amounts to 1.1 per cent of the economy-wide wage bill. But the NLW isn’t the only cause of these increases, and workers’ wages would have increased even if the NLW had remained constant. Other factors also push up wages: inflation expectations, productivity growth and the degree of tightness in the labour market.
Accounting for these other factors, we estimate that the 6.7 per cent increase in the minimum wage in April 2025 contributed between 0.1 and 0.5 percentage points of the 8.1 per cent increase in the economy-wide wage bill this year. This is consistent with Bank of England estimates that the NLW increase pushed up annual pay growth by 0.2 percentage points in 2025.
To translate these wage bill impacts into overall inflation impacts there a few more factors we need to account for.
- Some goods and services are imported. Because they are made abroad, the NLW does not feed into their production costs. Imported products make up around a quarter of products in the Consumer Price Index (CPI) basket.
- For domestically made goods, we need to account for the other costs that producers face. This includes things like energy, raw materials and rents – we call these ‘non-labour costs’. Non-labour costs are equivalent to around 30 per cent of output.
Putting all of this together, we estimate that increases in the NLW led to a roughly 0.06 to 0.24 percentage point increase in the April 2025 inflation rate (which was 3.5 per cent). While the NLW is a major cost driver in some industries, its overall impact on the economy-wide wage bill and prices is minimal. This is likely to remain the case for the April 2026 increase. In February 2026, the Bank of England stated it expected the minimum wage increase to have a negligible impact on overall wage growth.
Q&A section
If minimum wage workers get a pay rise, doesn’t everyone else demand one too?
- Most workers receive a pay rise each year. This pay rise is usually the result of bargaining between workers and employers, whether individually or collectively (for example, between an employer and the workers’ union).
- Negotiations between workers and employers will be informed by a number of factors, of which the minimum wage increase may be one. Other factors may include: the current and expected rate of inflation, improvements in worker productivity, changes in worker responsibilities, the differentials between different levels of employees, pay increases at similar firms, and consideration of how difficult it might be to replace an employee (or group of employees) if they left.
- The balance of considerations will vary across firms, industries, regions and skill levels. However, the higher a worker’s wage the less influence the minimum wage is likely to have. Usually, we think of the minimum wage as influencing the pay of the bottom 35 per cent of the hourly pay distribution (in April 2025, this meant people earning up to £15.17/hour).
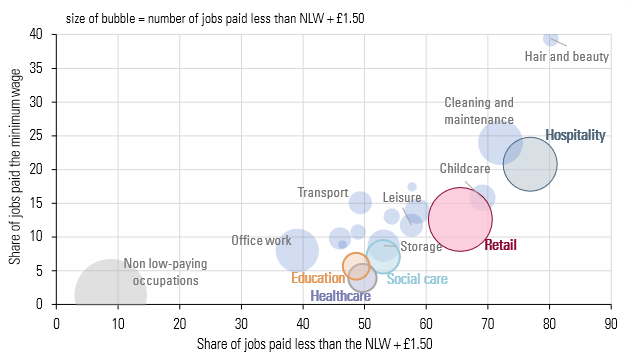
The cost of eating/drinking out has risen a lot – the minimum wage might not be driving overall inflation, but in certain sectors it must be having an effect…
- Yes, the minimum wage’s impact on prices will vary across industries. Some industries, such as hair and beauty, childcare, and hospitality (which includes eating and drinking out), have high shares of minimum wage and other low-paid workers.
- Because of this, in these industries the minimum wage has more of an impact on labour costs, which is then likely to flow through to prices. However, in other sectors with few low-paid workers, the minimum wage has little impact on labour costs and prices.
If you don’t think employers are putting up their prices, then how are they adjusting to these cost increases?
- Employers adjust to minimum wage increases in a combination of ways. The specific mix of responses available to them can vary greatly by sector, by size of business and by location. Some businesses may look to get more out of their workers, some will restructure their workforce, others will look for other savings or efficiencies, and others say they will take on fewer workers and/or reduce hours of work. Many businesses choose to absorb the minimum wage in their profits.
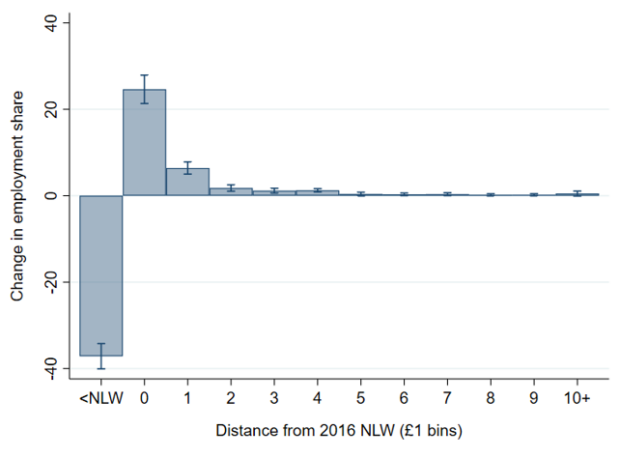
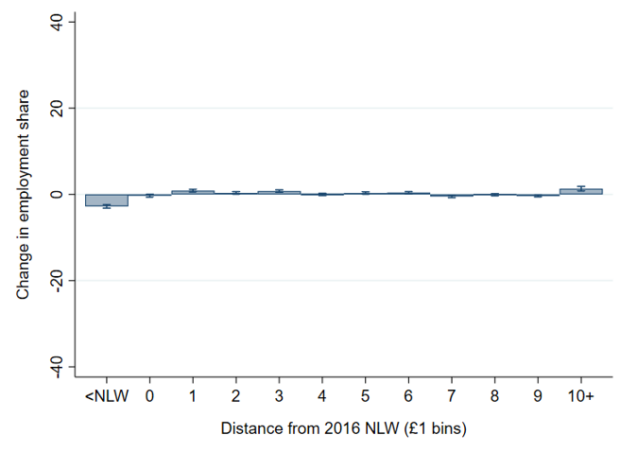
- Although many businesses say they will reduce the number of their employees, at the economy-wide level we have not seen any evidence that the minimum wage has significantly reduced employment. Prior to 2019, several studies found that the introduction of the NLW had not negatively affected employment. Since 2019, our evidence base has been less reliable due to the confounding effects of the pandemic and the deterioration in the quality of labour market statistics. However, our assessment is that the NLW has not had widespread negative effects on employment.