At the Low Pay Commission (LPC), we do a lot of work to monitor trends in the low-paid labour market. Each year, we talk to employers and workers across a range of sectors, as well as producing bespoke analysis on jobs and business conditions from a low pay perspective.
But what do we mean by low-paid labour market? We want to identify the businesses and workers who are most affected by the minimum wage. This doesn’t mean looking only at those paid at the minimum; changes in the minimum wage have spillover effects on the wages of those paid some way above it as well.
To help us identify these workers and businesses, we use two definitions: low-paying occupations relate to job roles that are often low-paid – for example, ‘sales assistants’; low-paying industries are based on the main activity of the employer – for example, ‘retail trade’.
These definitions were last updated in 2017, shortly after the introduction of the National Living Wage (NLW). A lot has changed since then: the level of the minimum wage has increased rapidly, potentially changing the types of workers and businesses affected by it. The ONS has also updated how it classifies occupations, moving to a new set of standard occupational codes (SOC 2020) in the datasets we use. This move was completed for the Annual Survey of Hours and Earnings (ASHE) – our main data source for hourly pay – in autumn 2022.
To make sure our work keeps up with these changes – and remains relevant once the NLW meets its target in 2024 – we have reviewed and updated our definitions of low-paying occupations and industries. This blog outlines the changes we’ve made. We have also published tables with full details of the new occupation and industry groups, available here.
What we’ve changed
There is considerable continuity between our old and new definitions. Many of the occupations and industries most affected by the minimum wage in 2017 continue to be amongst the most affected today. Retail and hospitality remain the occupation and industry groupings with the largest number of minimum wage workers, and the new definitions do not change the overall trends in employment in low-paying sectors (see Figure 1).
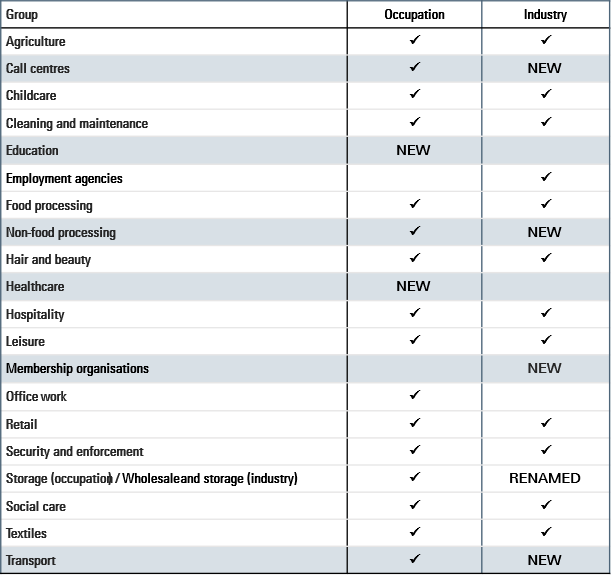
The most significant change is the addition of two new occupation groups covering low-paying roles in education and healthcare, such as teaching assistants and hospital porters. These groups include a large number of workers paid just above the current NLW. We expect these workers will continue to be paid above the minimum, but their rates of pay are still likely to be influenced by the NLW.
We have also added several new industry groups, including transport and non-food processing. The new industry groups are small and don’t significantly change the scale or characteristics of the low-paying industries when taken together. A full list of the revised occupation and industry groups can be found at the end of this blog.
Figure 1: Number of workers employed in low-paying occupations (LHS) and industries (RHS), UK, 2014-2023
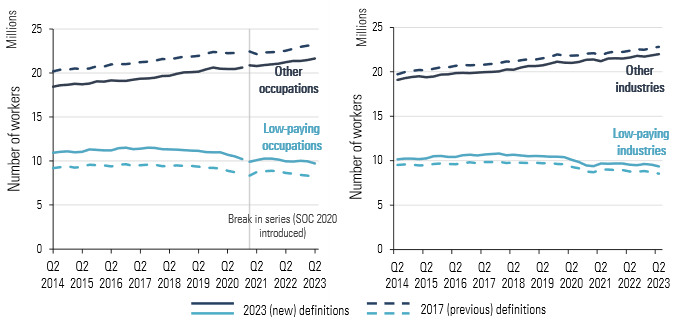
As Figure 1 shows, more people are employed in low-paying sectors under the new definitions. Occupations see the largest change. The new education and healthcare groups explain around half of this increase, with most of the remaining increase explained by new job roles added to the ‘office work’ occupation group.
This doesn’t mean that there are more low-paid workers in the workforce – or that pay of workers in the new occupations has got closer to the minimum wage. In fact, many of the new groups were already considered ‘borderline’ in the last review in 2017. In some cases, the change to SOC 2020 has allowed us to split lower- and higher-paid groups that were previously classified together – such as teaching assistants and higher-level teaching assistants. But our new approach is also intentionally broader to reflect what we know about spillovers from the NLW.
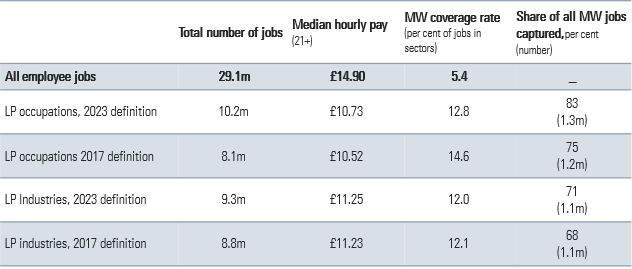
This means we capture more minimum wage jobs: over 80 per cent of minimum wage jobs are now in a low-paying occupation (Table 1). On the other hand, we also capture more better-paid workers. This slightly reduces the share of jobs in the new low-paying occupations that are paid the minimum wage (‘coverage’). However, the majority of these better-paid jobs are still paid close enough to the minimum wage to be affected by it.
Table 1: Summary statistics for new low-paying sectors, April 2022
Wages and workers in low-paying sectors
As the NLW has increased, it has pushed wages up – not only for those on the minimum wage, but also those paid some way above it. Research we commissioned from the IFS (Cribb et al, 2021) suggests that these spillovers affect wages up to £1.50 above the NLW. We took this into account when we defined the new low-paying sectors.
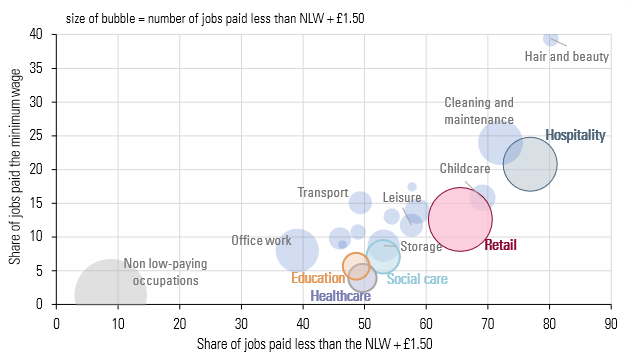
Figure 2 compares the share of jobs paid below this higher in each of the new low-paying occupations to the share covered by the minimum wage. The size of the bubbles illustrates the number of jobs paid less than £1.50 above the NLW. This shows how the two new occupation groups – education and healthcare – have low minimum wage coverage compared to the other occupation groups, but higher broad coverage (NLW + £1.50) than other established occupation groups, such as non-food processing, office work and call centres. In this they are similar to the existing social care group.
Figure 2: New occupation groups: minimum wage coverage compared to broader coverage, UK, 2022
The differences between workers in low-paying and other occupations and industries are not limited to pay. Part-time work, zero-hours contracts and temporary contracts are more common for those working in low-paying occupations, while small firms are more likely to be in low-paying industries. This remains true under both old and new definitions.
The new definitions increase the share of women falling into low-paying occupations – where they were already over-represented. They also capture more public sector workers, although the private sector continues to predominate in both low-paying occupations and industries.
There is a lot of overlap between low-paying occupations and low-paying industries – for example, just under 60 per cent of jobs in low-paying occupations are in low-paying industries. But occupations and industries do not map directly onto one another: there are many workers in low-paying occupations within non-low-paying industries (such as a call centre worker at a utility company) and vice versa. By the nature of occupation and industry definitions, low-paying occupations tend to have a higher concentration of workers paid close to the minimum wage than low-paying industries.
What next
We will use the new low-paying occupation and industry definitions in our work going forward. While we transition, we’ll continue to compare them to the old definitions and provide figures under both where necessary.
If you’d like to know more, you can find a full list of the occupations and industries included in the new groups on our website, alongside an overview of the methodology we used. We’ll also feature more on the new low-paying sectors in our forthcoming 2023 Report.
Table 2: Revised list of low-paying occupation and industry groups