Giulia Giupponi, Bocconi University
Sam Ray-Chaudhuri, Institute for Fiscal Studies
Xiaowei Xu, Institute for Fiscal Studies
February 16, 2024
The introduction of the National Living Wage (NLW) in April 2016 marked the start of a series of increases in the level of the UK minimum wage which have brought it close to the international frontier. The ambitious level and coverage of the NLW have made it the flagship policy aimed at helping low-paid workers in the UK. In both the UK and internationally, there is broad consensus that minimum wages are effective at raising wages at the bottom of the distribution, as intended. But this compression of the wage distribution – commonly referred to as a reduction of ‘pay differentials’ between different jobs – may also create challenges for firms, above and beyond the direct cost implications of raising wages for the lowest paid. Here we briefly set out evidence on the extent of wage compression within firms caused by the UK’s NLW.
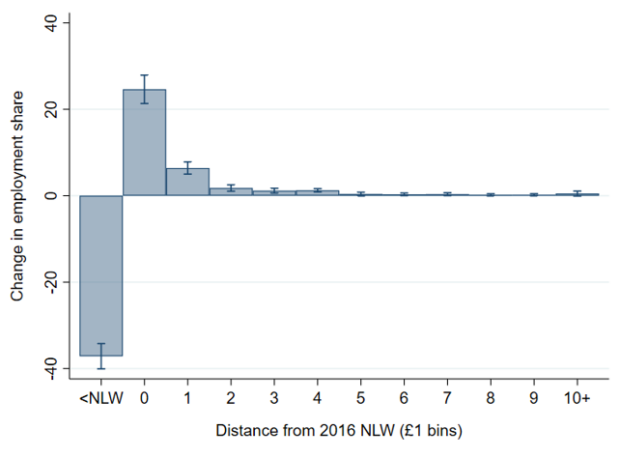
The compression of the wage distribution that has been observed across the UK labour market is clearly visible within firms, and primarily for those firms employing larger fractions of their workforce at low levels of pay. This can be seen in Panel A of Figure 1, which plots the average change in the share of firms’ workforce (vertical axis) paid at each wage level (horizontal axis), comparing the years before the NLW introduction (April 2012 to April 2015) with those after (April 2016 to April 2019). The chart is based on a sample of large firms that employed at least 20 per cent of their workforce below the 2016 NLW in April 2015, i.e. a group of firms that were heavily exposed to the introduction of the NLW. We restrict our analysis to large firms because in the UK we only have survey data with wage information on a subset of firms’ employees, meaning for small firms we cannot confidently measure their exposure. Still, our large firm sample covers 46 per cent of employees in the UK, with one fifth of these in firms that were heavily exposed to the NLW introduction (Panel A).
Figure 1. Change in within-firm employment share by wage bin, pre- and post-NLW (ppts)
Panel A: Heavily-exposed firms
Panel B: Less-exposed firms
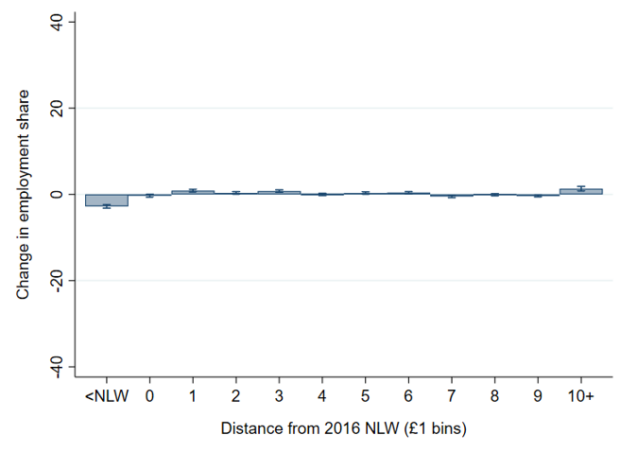
Note: Sample of large firms (at least 20 observations in 2015 ASHE) corresponding to 46 per cent of all worker-year observations. Pre-NLW refers to 2012-15, post-NLW refers to 2016-19. Panel A is based on a sample of firms where NLW coverage in 2016 was at least 20 per cent (19 per cent of our sample), Panel B is based on a sample of firms with coverage below 20 per cent (81 per cent of sample). Error bars show 95 per cent confidence intervals. The x-axis measures distance to the 2016 NLW in 2016 prices (CPI).
Panel A of Figure 1 shows a sharp reduction in the share of employees paid below the 2016 NLW and a large increase in the share paid at the 2016 NLW itself. Interestingly, we can also see a smaller, though positive increase in the fraction of workers paid one and two pounds above that minimum, with no detectable change at higher wage levels. Panel B is constructed in the exact same way as Panel A, but uses a sample of large firms with limited exposure to the NLW introduction, namely firms that employed less than 20 percent of their workforce below the 2016 NLW in 2015. Here effects are much more muted throughout the wage distribution.
Three key observations emerge from Figure 1. First, the introduction of the NLW generated substantial within-firm wage compression at the bottom of the distribution. Second, this effect is more pronounced among heavily exposed firms. Third, following the introduction of the NLW, wage increases occurred not just at the level of the new minimum, but also up to two pounds above it. Thus, employers who employ significant numbers of minimum wage workers also raise the wages of some workers above the minimum. These “wage spillovers” mitigate the overall impact on pay differentials between jobs close to the bottom of the national wage distribution (though within low-wage firms these effects can stretch a long way up the within-firm wage distribution, as shown below). In additional analyses, we found that spillover effects tend to be larger among incumbent employees than among new hires, and larger in public or unionised firms. Some care should be taken inferring the exact size of the spillovers from these charts, since subsequent increases in the NLW between 2017 and 2019 mean the real distance between the current NLW and its 2016 level is positive rather than zero (although less than one). This means spillovers after 2016 may be overstated slightly.
We also investigate the effect of the introduction of the NLW on wage ratios within firms. Wage ratios are a measure of wage inequality between workers at different points in the firm’s wage distribution. In order to do this, we divide firms into four groups depending on the ‘coverage’ at the NLW introduction. Here, coverage measures the share of workers in a firm who were paid below the 2016 NLW in 2015. Table 1 shows the effect of the introduction of the NLW on the wage ratios of firms in each group, relative to the least exposed group of firms (those with less than 5 per cent coverage).
We see that the NLW led to a decline in the 90-10 and 50-10 ratios for less-exposed (5-20 per cent coverage) and moderately-exposed (20-40 per cent coverage) firms, but not in the highly-exposed firms (40-100 per cent coverage). This is because the majority of workers in the highly-exposed firms earn at or near to the minimum wage, and so there are limited differentials to be reduced. There is evidence of a fall in the 90-50 ratio for the moderately- and highly-exposed firms, showing that the effects can extend far up the wage distribution in firms with many minimum wage workers. It is an important reminder that, in those firms where many of the impacts of the NLW actually play out (i.e. highly-exposed firms), and whose reactions will matter most in shaping the impacts of the NLW, it is by no means merely a matter of bringing the very lowest-paid workers closer to the rest. These firms are typically responding to a shock much more substantial than that.
Table 1. Change in within-firm wage ratios relative to ‘least exposed’ firms (< 5 per cent coverage)
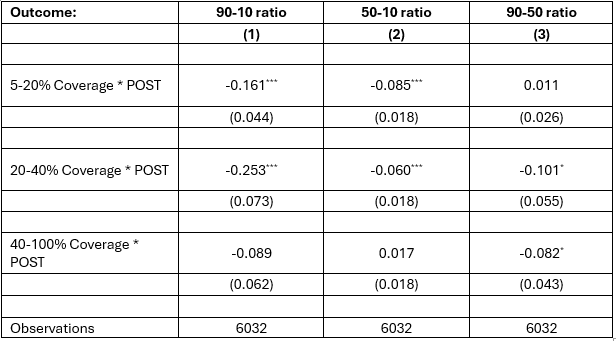
Note: Changes in levels of the ratio. Sample of large firms (at least 20 observations in 2015 ASHE) corresponding to 46 per cent of all worker-year observations in ASHE. Standard errors shown in parentheses. These stars indicate whether the results are statistically significant at different critical values (denoted by p). *p<0.10 **p<0.05 ***p<0.01
Employers worry about shrinking wage differentials since they can reduce workers’ incentives to do, or progress into, more demanding roles. Restoring wage differentials is however costly. Depending on their ability to adjust pay scales, firms might respond to wage compression in different ways. Those that can cope with wage bill increases might partly restore wage differentials by raising the pay of workers above the minimum wage. We see evidence of these wage spillovers in Figure 1, though we only observe substantial spillovers up to £2 above the incoming rate.
Survey evidence for the UK suggests that some firms have responded to pay compression by changing their organisational structures and cutting back on job ranks above the minimum to maintain pay differentials between staff levels (Low Pay Commission, 2020). To capture the extent of changes in occupational structure, we group occupations into 10 deciles based on the nationwide median wage in that occupation before the introduction of the NLW. We then use the share of employment in each of these occupation-wage groups as a proxy for the occupational structure of the firm. Figure 2 shows the association between the coverage of the 2016 NLW in 2015 and in the change in employment share from before to after the introduction of the NLW. We do not see significant differences, suggesting that the introduction of the NLW did not lead to any changes in firm structure by this measure. This does not rule out the possibility of more subtle changes – wage hierarchies are difficult to observe in survey data containing only a subset of employees, and the removal of grades on a pay scale may not show up in occupational changes in the data.
Figure 2. Association between NLW coverage and change in employment share by occupation wage decile
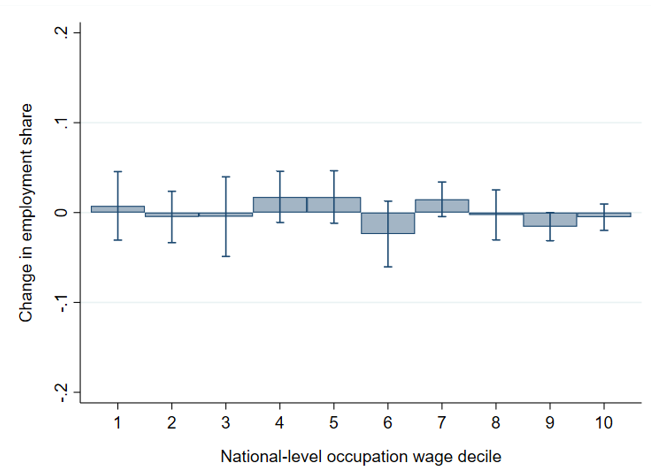
Note: Sample of large firms (at least 20 observations in 2015 ASHE) corresponding to 46 per cent of all worker-year observations in ASHE. Pre-NLW refers to 2012-15, post-NLW refers to 2016-19. Error bars show 95 per cent confidence intervals. Occupation wage decile based on pre-NLW median wage for each 3-digit SOC code.
The evidence presented in this piece shows how minimum wage increases can have a significant impact on highly exposed firms. There are various ways they might respond to the large cost shock and/or the change in their pay differentials – for example, by adjusting their pay setting, contractual arrangements or organisational structure. Those responses, which remain relatively under-studied, would potentially have their own important implications for the careers of low-paid workers.
References
Low Pay Commission. 2020. “National Minimum Wage Low Pay Commission Report.” Low Pay Commission.
This blog summarises a piece of research on the impact of the NLW on differentials commissioned by the Low Pay Commission. It is written by the researchers listed at the top of the article. We will publish the full research article in late 2024.