A wide range of evidence suggests that the National Minimum Wage (NMW) has succeeded in raising pay for the lowest-paid workers significantly without damaging employment or the economy. However, the benefits of the NMW have been more muted for workers further up the earnings distribution reflecting the design of a policy that has sought to have no significant negative impact on employment.
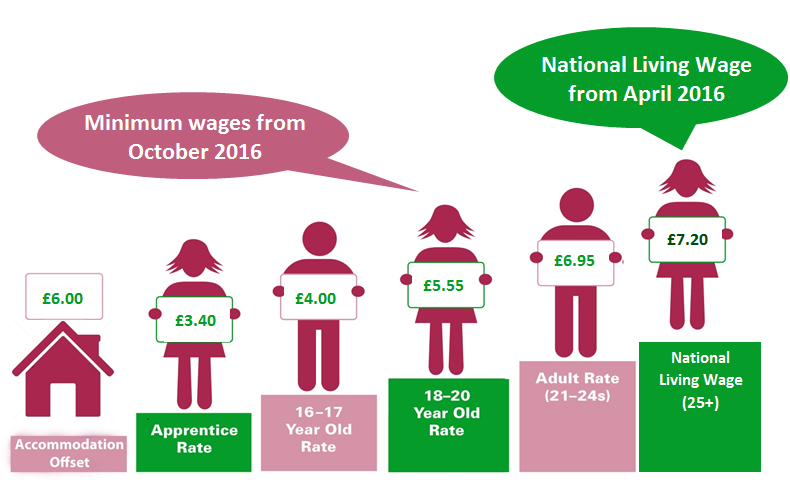
Announced by the Chancellor in the 2015 Summer Budget, the introduction of the National Living Wage (NLW) will be a potential game changer: the NLW is set at a higher rate of £7.20, increasing hourly pay by 7.5 per cent and 10.8 per cent year on year. The Government aspires to raise it to 60 per cent of median earnings by 2020 – just over £9 based on the latest Office of Budget Responsibility (OBR) hourly earnings growth forecasts. The introductory rate is set to increase nominal annual earnings for a typical worker currently on the NMW by £680, rising to £3,360 by 2020.
The higher rate is enabled by two features of the policy: first, the NLW has been established with somewhat greater tolerance of negative employment consequences than the NMW (the OBR estimates job losses of 20,000-120,000 by 2020); second, it is targeted on workers aged 25 and over, who on average have more experience and higher median pay, so may be able to bear a higher wage floor. The Low Pay Commission (LPC) will advise on the NLW path to 60 per cent of median earnings by 2020 ‘subject to sustained economic growth’ and continues to recommend rates for those aged under 25 and apprentices on our traditional basis of ‘helping as many low-paid workers as possible without damaging their employment prospects’.
In the light of this new remit, the LPC has looked at the implications of the NLW using four measures of the minimum wage impact: bite, coverage, wage bills and international comparisons. The charts that follow are all taken from our Spring 2016 report. They suggest that the policy represents a significant change for the UK labour market.
Bite
The bite is a measure of the rate of the minimum wage relative to median earnings. A higher bite for a particular sector or age group means a more compressed earnings distribution, implying the minimum wage is becoming the ‘going rate’ in that part of the economy, with consequent challenges for pay and career progression (though it should also be noted that employment has continued to grow in many sectors with high bites).
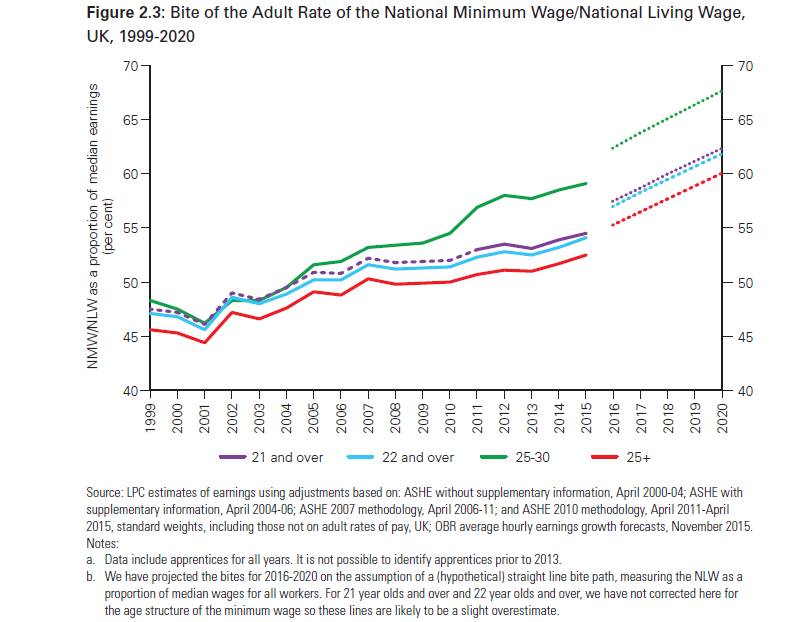
The introduction of the NLW for employees aged 25 and over at £7.20 will increase the bite for this group from just over 52 per cent in 2015 to just over 55 per cent in 2016. The bite is set to increase to 60 per cent of the median by 2020.
One striking feature of this increase is its pace. The percentage point increase in the bite of the minimum wage for those aged 25 and over is estimated to be greater over the five years 2015-2020 than it was in the previous 16 years.
Another striking feature of the increased bite is how much it is set to vary across the economy and workforce. If 60 per cent is the average for workers aged 25 and over by 2020, inevitably it will be much higher for some workers, businesses and places and much lower for others. (It should also be borne in mind that a 60 per cent bite for workers 25 and over is slightly higher – around 62 per cent – for all workers)
The increase is likely to be higher for: those who are aged 25-30 or over 60; those working in Wales, Northern Ireland and outside the South East of England.
The increase is also likely to be higher for those working in low-paying occupations and sectors like retail, hospitality, social care and cleaning and those working in small firms. In cleaning and hospitality the bite could be 100 per cent, meaning half or more of workers aged 25 and over will be on the minimum wage.
The bite will also be higher among workers with no qualifications, those with disabilities, migrant workers, female workers and ethnic minorities.
Coverage
The story of the impact of the NLW on coverage of workers is similar to that of the bite, with estimated proportions of all workers on their age-related minimum wage rate set to rise from 5.2 per cent (1.4 million) in 2015 to 8.2 per cent (2.2 million in 2016) and then to 13.7 per cent (3.7 million) in 2020.
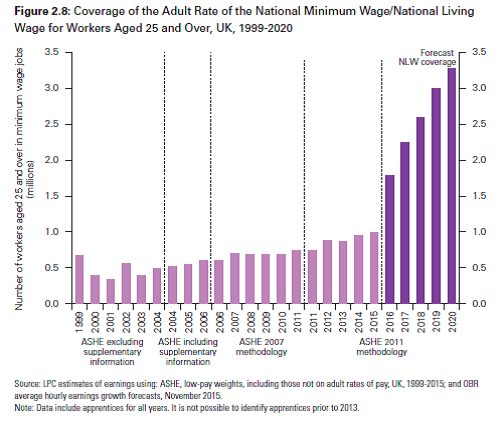
This increase is largely driven by workers aged 25 and over who will see their coverage almost treble from just under one million in 2015 to over 3 million in 2020.
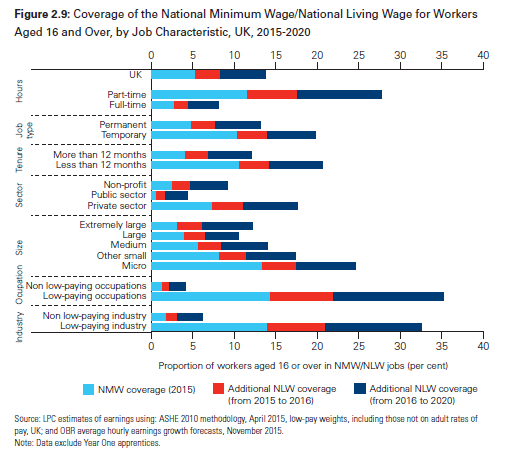
As with the bite, the increase in coverage is likely to vary across age groups, regions, sectors and firm size. In 2016, an estimated 11 per cent of private sector jobs, 17 per cent of jobs in micro firms, 18 per cent of part-time jobs, 41 per cent of jobs in cleaning, 31 per cent of jobs in hospitality and 34 per cent of jobs in hairdressing are likely to be paid at the minimum wage.
By 2020, an estimated 18 per cent of private sector jobs, 25 per cent of jobs in micro firms, 28 per cent of part-time jobs, 45 per cent of jobs in hairdressing and 55 per cent of jobs in cleaning are set to be minimum wage jobs.
Coverage is set to rise to more than one in six jobs in Yorkshire and the Humber, the North East, Northern Ireland (all 17 per cent), the East Midlands and Wales (both 18 per cent) by 2020.
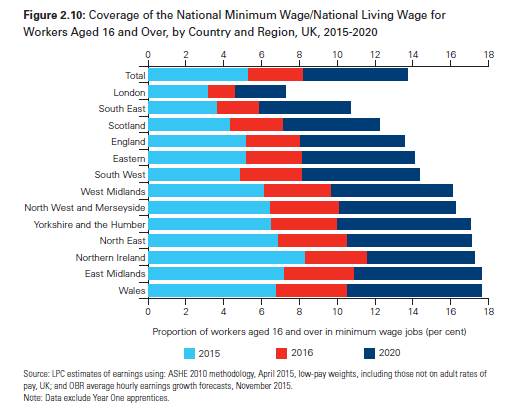
Coverage will also be much higher for workers aged 25-30 and 65 and over, and more than doubles for workers with no qualifications, those with disabilities, migrant workers, female workers and ethnic minorities. Up to one in four workers in these groups (rising to one in two for unqualified workers) is set to be on the minimum wage.

Wage Bills
As well as looking at bite and coverage, we sought to identify the additional wage cost above what would have happened in the absence of the NLW – we have assumed that pay generally increases in line with average earnings growth, and reported these costs in 2015 terms.
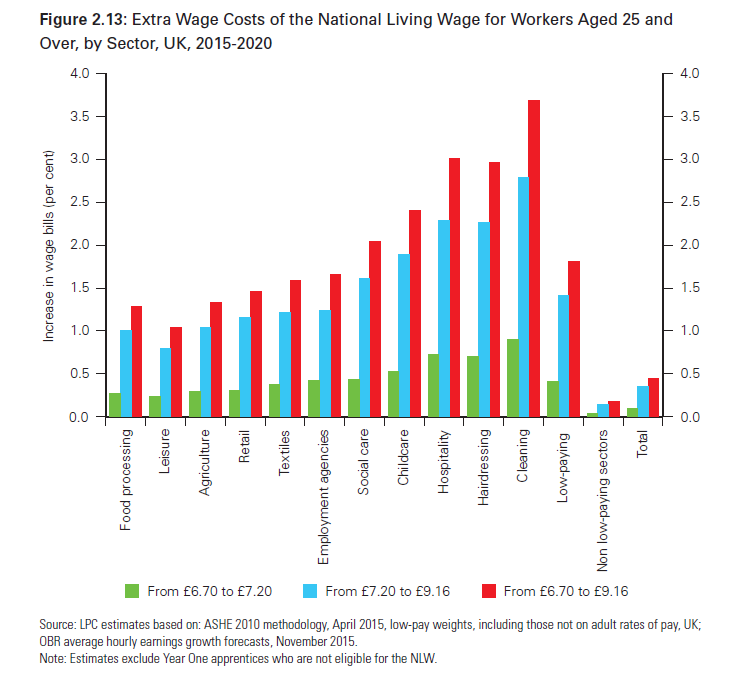
We estimate that the NLW is set to raise wage bills by an estimated £0.7 billion or 0.1 per cent in 2016, and then further raises wage bills by an estimated £2.4 billion or 0.4 per cent by 2020. These are marginal wage costs, on top of average earnings growth. They are sensitive to assumptions about the ripple effects on pay of workers earning above the minimum wage - so called spillovers.
Further, the costs vary by sector with low-paying industries most affected. For example, total extra costs of the NLW added to wage bills range from 1.0 per cent in leisure to 3.7 per cent in cleaning, with a 1.8 per cent increase across the low-paying sectors as a whole. This is higher than a 0.5 per cent increase in the whole economy and 0.2 per cent in the non low-paying sectors as a whole.
International Ranking
A final area of focus is the UK’s international ranking where we compared the UK’s coverage and bite with those from other OECD countries. This measure is relevant because the 60 per cent target for the NLW partly reflects international evidence that some countries had minimum wages at this level.
Our analysis shows the UK is likely to remain in the middle of OECD rankings in terms of the bite against the mean or median when the NLW is introduced in 2016 but move to an upper-middle ranking by 2020. But OECD rankings may understate the UK’s position because they do not adjust for differences in age structure between minimum wages, plus they compare across full-time workers (whereas the UK has a high proportion of part-timers, who tend to be lower paid). Adjusting the data to take account of these factors, the NLW appears to move the UK nearer the top of the rankings by 2020 for its relative value to median earnings.
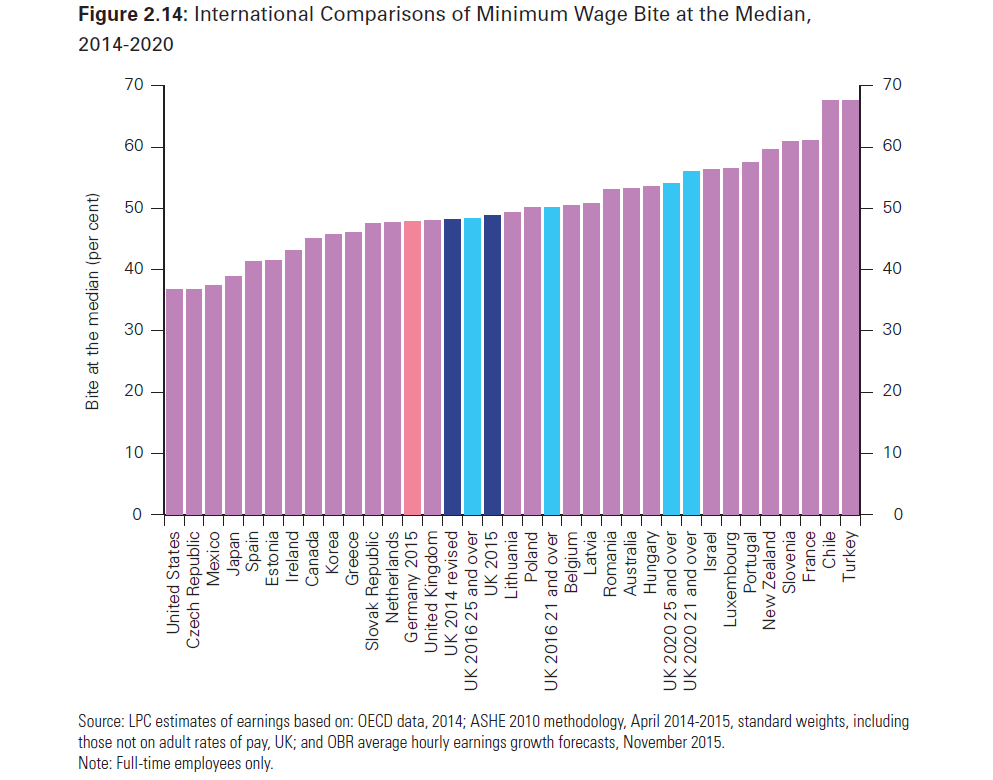
A limitation of these comparisons is that they provide little insight into the affordability of different levels of minimum wages between countries. To be properly understood, this kind of data needs to be interpreted alongside wider labour market evidence on employment and unemployment (for example, France has a minimum wage with high bite, but also relatively high youth unemployment).
Stakeholder Views
Apart from this kind of in-house analysis, we carried out both a written consultation and visits to capture as broad a spectrum of views as possible. These stakeholder views reflect nearly 100 written responses and more than 50 businesses visited, including from both employers and employees in the low-paying sectors.
In our consultation, most businesses and employees alike welcomed the goal of higher pay as an important objective. However, the detailed responses were more divided. Trade unions were strongly supportive but sought further ambition, often citing the voluntary UK Living Wage.
Among employers, some were supportive, arguing a more ambitious pay floor was affordable. Others were concerned about the introductory rate of £7.20 – mainly in sectors like social care, small retail, agriculture and textiles, and some SMEs. Many fell into a third grouping: those who felt that the April 2016 level was manageable, but were concerned about the 2020 goal of 60 per cent of median earnings. Few firms had yet thought seriously about how they planned to adapt to address successive increases. A key theme across responses was uncertainty, with little information on the impacts of the NLW on differentials and on costs through the supply chain.
Overall, the NLW is likely to mean a significant change to the UK labour market, directly affecting over three million workers, especially for those who are disadvantaged and work in the low-paying sectors.
Looking forwards, we’ll continue to use an evidence-based approach to monitoring the impact of the NLW alongside that of the wider minimum wage for those aged under 25 and apprentices.
We are interested in hearing your personal experience of the National Living Wage, and welcome your views and perspectives in our forthcoming consultation in April.
1 comment
Comment by arecoo posted on
"
Among employers, some were supportive, arguing a more ambitious pay floor was affordable"
I do not agree, read: http://www.radiusworldwide.com/blog/2012/2/us-vs-uk-employment-law-whats-difference
Aretha