Why is employment still lower than it was three years ago?
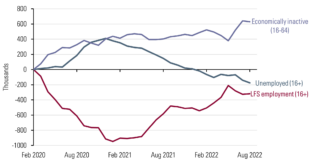
Total employment in the UK fell following the pandemic and still has not recovered to pre-pandemic levels. The red line in the figure below shows that in August 2022, employment was still over 300,000 lower than it was pre-pandemic. The culprit for this reduced employment is increased economic inactivity (people not able to work or not actively looking for work) rather than unemployment (people actively searching for work).
Figure 1: Change in Economic Activity, UK, Feb 2020 – Aug 2022 [1]
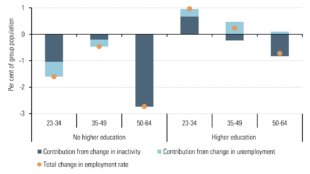
This increase in inactivity has caused a flurry of analysis, including useful contributions by the IFS, IES and the Resolution Foundation [2],[3],[4]. The increase in inactivity has been more marked amongst older workers and workers without a higher education, as shown in the figure below. Students and long-term sickness are the two reasons for inactivity which have seen the biggest increase since 2019. Despite this, the IFS and others find that increased retirement is a more important reason for the increase in movements from employment to inactivity than increases in ill health.
Figure 2: Change in employment rate, by age and qualification, UK, 2019 Q2 - 2022 Q2 [1]
How has increased inactivity affected low-paying occupations?
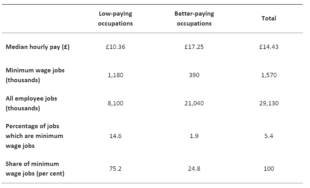
So what does all this mean for low-paid workers? Increased inactivity has not affected all workers and jobs evenly. At the Low Pay Commission, we are most interested in the occupations which employ lots of minimum wage workers. We refer to these as “low-paying occupations.” Retail, hospitality, social care and cleaning are the four biggest low-paying occupations and the table below shows that three-quarters of all minimum wage jobs are in occupations that we define as low-paying. A full definition of low-paying occupations is available in Appendix 4 of our 2022 Report.
Table 1: Prevalence of minimum wage jobs, by occupation [5]
In our analysis last year, we investigated the effects of increased inactivity on low-paying occupations. We track the movements into and out of jobs between 2019 and 2022 for those aged 23 to 64. We compare the total number of moves in 2019-2022 to the previous three-year period (2016 to 2019). The table below reveals a complex picture.
Table 2: Change in number of labour market moves, by occupation, UK, 23-64 population, 2019 Q3 - 2022 Q2 compared to 2016 Q3 – 2019 Q2 [1]
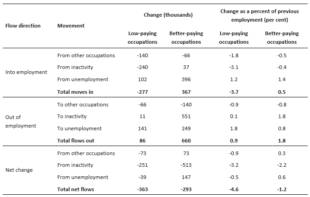
The big increase in people leaving their jobs and not looking for another (becoming inactive) happened in better-paying occupations. There were 551,000 more moves into inactivity from better-paying occupations in 2019-2022 than in 2016-2019, but only 11,000 more from low-paying occupations. This chimes with the IFS analysis, which suggests that increased retirement is a key driver of increased movements into inactivity amongst older workers. [2] We would expect workers in better-paying occupations to be more likely to decide to retire as they are more likely to have the pensions and other savings necessary to make that decision. University of Essex researchers found that moves into inactivity amongst older workers increased most for those with mid-level hourly pay [6].
However, increased inactivity is not just due to more people moving out of employment, movements the other way matter too. During the last three years, fewer people moved into low-paying occupations from inactivity. Low-paying occupations are more likely to require interpersonal interactions, so the reluctance of workers to move into these occupations could reflect continued health concerns. Barrero et al. (2022) [7] document evidence that “long social distancing” in the US is reducing the employment rate by up to 2 percentage points. They find that it disproportionately affects low-paid jobs which involve interpersonal interactions. It is possible a similar trend is affecting employment in the UK.
Low-paying occupations have also lost workers to better-paying occupations. The net movements (movements in minus movements out) into low-paying occupations from better-paying occupations decreased by 73,000 in 2019-2022 relative to the previous three-year period. This may reflect more workers moving into better-paying occupations to backfill the half a million additional workers who moved into inactivity. In our consultations over the last two years, employers have told us that many workers were moving out of occupations such as hospitality which require evening and weekend work to other jobs with more convenient hours.
Similarly, while non low-paying occupations have managed to make up for some of the workers they lost to inactivity through increased hiring from the unemployed, low-paying occupations have seen the net flow of jobs from unemployment fall by 39,000.
Overall, changing labour market movements have disproportionately reduced employment in low-paying occupations. Net movements into low-paying occupations have fallen by the equivalent of 4.6 per cent of employment in low-paying occupations, whereas net movements into other occupations have fallen by only 1.2 per cent of employment in other occupations.
What does increased inactivity mean for pay in low-paying jobs?
Increased inactivity, alongside other factors such as changes to migration policy, has made it harder to recruit into low-paying occupations. Vacancy rates have hit record highs in hospitality and social care. We also heard that employers have been relying more on younger workers to fill vacancies.
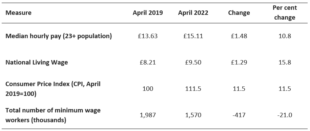
Some employers in low-paying occupations have raised pay to try and attract workers. UKHospitality told us last summer that: ‘The workforce supply crisis has led to substantial increases in basic rates of pay with intense competition between firms…We are seeing many firms having joining/starter rates of pay well above the statutory minimum.” We can see the increase in pay for low-paid workers in the data. The number of jobs paid the minimum wage fell by 21 per cent between April 2019 and April 2022, despite the minimum wage increasing faster than prices (measured by CPI) or median hourly pay over this period. [1]
Table 3: Change in pay, prices and number of minimum wage workers, April 2019-April 2022 [5]
The government is right to worry about increased inactivity. It has many negative effects. However, for people still working it may have some benefits. The reduced availability of workers is one factor that has raised pay for the workers left behind (especially those in low-paying occupations).
We discuss these issues in more detail in our 2022 report.
Notes:
[1] For a more detailed discussion and full source notes for charts, see LPC Report 2022.
[2] Boileau, B., and J. Cribb (2022). Is worsening health leading to more older workers quitting work, driving up rates of economic inactivity? Institute for Fiscal Studies. 26 October 2022.
[3] Wilson, T., and Muir, D (2022) Evidence paper to support the launch of the Commission on the Future of Employment Support Institute for Employment Studies
[4] Murphy, L. (2022) Record lows in unemployment and record highs in long-term sickness poses huge challenge for policy makers Resolution Foundation
[5] Source: LPC analysis of ASHE using low-pay weights (job numbers) and standard weights (median pay), 2022, UK. Total job figures may not match other estimates as they use low-pay weights rather than standard weights.
[6] Carillo-Tudela. C, Clymo. A, Comunello. C, Visschers. L, Zentler-Munro. D (2022), Policy Briefing Note: Rising Inactivity in the Over 50s post-COVID. Covid Jobs Research Paper
[7] Barrero. J.M, Bloom. N, and Davis. S.J (2022), Long Social Distancing. NBER Working Paper
