The National Living Wage has raised hourly earnings for the lowest paid workers in the UK since its introduction in 2016, but some have questioned whether the gains are reflected in workers’ weekly pay. Today’s Low Pay Britain report from the Resolution Foundation addressed some aspects of this issue. This post compliments their analysis and supports the conclusion that the NLW has not been a factor in poor weekly pay growth.
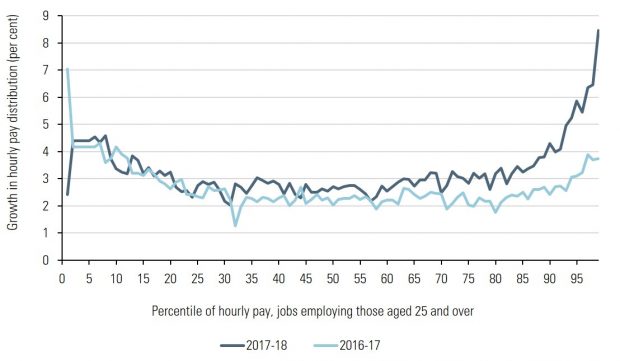
The chart below shows hourly wage growth across the pay distribution for the last two years. Its message appears simple: hourly pay has grown relatively quickly for those workers paid the minimum wage (at slightly over 4% in both years [nominal]), while growth for those at the median has been more subdued (at 2% in 2017 and 2.6% in 2018).
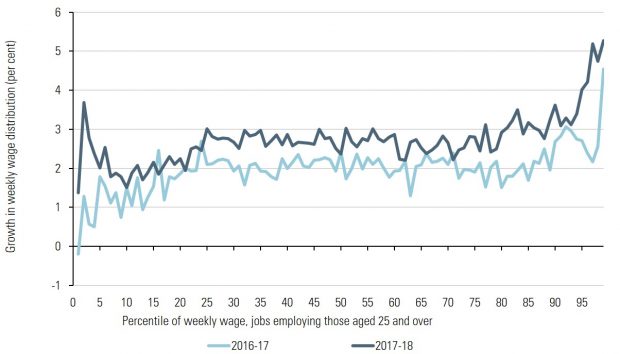
But when we look at weekly pay growth we see a contrasting pattern, it has been weakest for the lowest paid. Given that we know hourly pay has risen more quickly, the most intuitive conclusion is that hours of work must have fallen for the lowest paid. However, this is contingent on an important assumption: that low paid hourly workers and low paid weekly workers are the same people. Below we test this assumption.
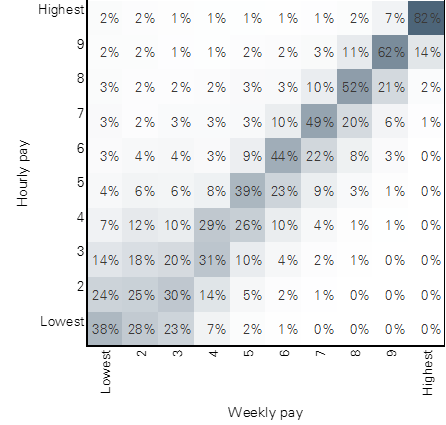
The table below maps each decile of weekly paid workers against that for hourly paid workers – the greater the correlation the darker the shading. Because these are deciles each row and column sums to 100%. The table shows that at the low end of the pay distribution the relationship between hourly and weekly pay is fairly weak. Just 38% (bottom left corner) of those workers in the lowest decile for hourly wages are in the same lowest decile for weekly wages.
The reason for this disconnect is part-time working, which forms a significant part of the UK labour market when compared internationally. Essentially, low paid weekly workers include some who have relatively high hourly rates of pay but low hours of work. Equally, some with the lowest hourly rates can find themselves in the 2nd and 3rd decile for weekly pay because they are doing relatively more hours of work.
The relationship between weekly and hourly pay strengthens as we move up the distribution so that 82% (top right corner) of the decile with the highest hourly wages are in the highest decile for weekly pay too. The correlation is strongest here because almost all workers are full-time.
At the LPC our concern is if the NLW is harming the hours of work of minimum wage workers. But if we focus on just those jobs paid the NLW (6.5% of all jobs) we can see that around three-fifths of them earn above the bottom 10% of weekly wages. NLW jobs make up around a quarter of the 5% of lowest weekly paid jobs and less than a third of the next lowest paid 5%. Therefore, it is not all that surprising that fast growth in the minimum wage may not lead to faster growth for jobs with the lowest weekly wages.
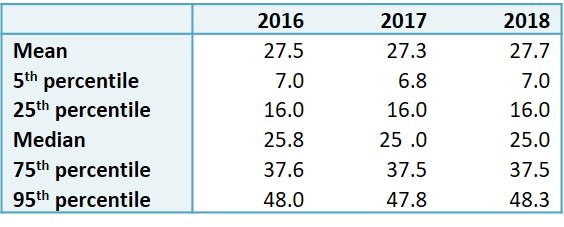
The data suggest that for NLW workers there hasn’t been much change in the average number of hours worked in a week over the last few years. The table below gives the number of hours worked by NLW workers at different points in the distribution, and shows that it has been similar in each of the last three years. This suggests that NLW workers working fewer hours is not a cause of the relatively weak pay growth we have seen in recent years amongst the lowest weekly paid.
This analysis offers reassurance that the NLW has been effective in raising pay. We also looked at the issue in our recent report on 20 years of the minimum wage and found broadly similar results. For more on weekly pay of NLW workers, see chapter 2 of our 2018 Report.