Data published today by the Office for National Statistics suggests that the National Living Wage (NLW) has made a big difference to the earnings of low-paid workers, helping part-timers and women in particular. But amidst the good news, one area of concern stands out.
The data show that at least 300,000 or 19 per cent of workers covered by the National Living Wage were paid below it in April 2016 - that’s about 1.3 per cent of the workforce aged 25 and over as a whole. This compares to 160,000 or 15 per cent of 25+ workers covered by the National Minimum Wage paid below the previous year - about 0.7 per cent of the workforce as a whole.
Underpayment is not the same as non-compliance as there are legitimate reasons for some workers to be paid below the minimum (for example, deductions for accommodation). But it would still be worrying if levels had doubled.
What’s going on?
Accurately measuring non-compliance is hard to do. This year, with the introduction of the NLW in April, it’s even harder…
Measuring different things
Today’s figures relate to underpayment at the introduction of the NLW, whereas those in April 2015 related to the mid-year point of the predecessor minimum wage. Previous research has found that non-compliance is higher the nearer you are to a change in pay, as employers take time to respond to the new rate. So, today’s data may be identifying a temporary problem. Non-compliance, however brief, is illegal, unacceptable and needs tackling. But it is different from persistent non-compliance, to which a mid-year underpayment measure is likely to be a better guide.
Figure 1: Hourly earnings distribution below NLW for employees aged 25 and over, UK, April 2016
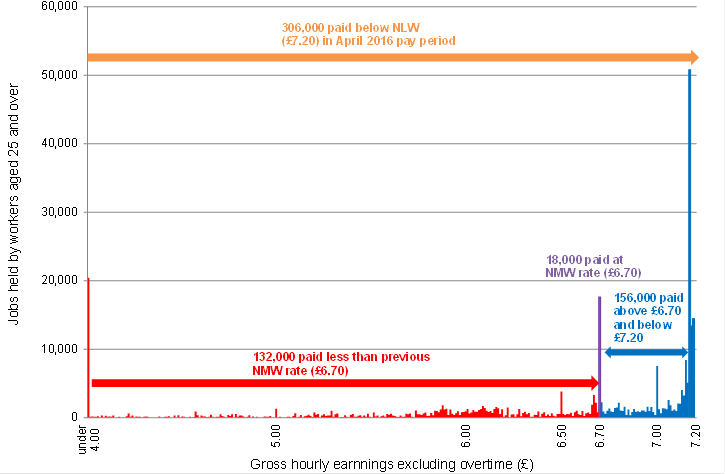
Source: LPC analysis of ONS data, ASHE 2016
The figure above shows the hourly pay distribution of all jobs paid below £7.20 in April 2016 using ONS’ methodology. We can see a large spike of people still being paid at the old NMW rate of £6.70, a smaller spike at £7.00 and a significant cluster paid just below the £7.20 NLW rate. Those paid between £6.70 and £7.20 are, we think, often cases of temporary non-compliance. Those well below £6.70 look more like they could be cases of persistent non-compliance.
Potential impact of the NLW
The other possible explanation for the change in underpayment is a genuine increase in levels in response to the NLW. We noted last year that there were reasons to expect underpayment could go up. The NLW is a new rate introduced at a new time of year to previous minimum wage upratings. The higher value of the NLW will have resulted in increased coverage of workers paid at the minimum. Many employers and sectors not previously affected by the NMW may have become caught up for the first time, possible resulting in increased underpayment. However our stakeholders, including employee representatives, have not reported higher non-compliance following the introduction of the NLW.
How robust are the figures?
In the event, and as we have pointed out before, we don’t have good estimates of how many workers are not being paid their legal minimum. The source of today’s data - the Annual Survey of Hours and Earnings (ASHE) - is our best guide, but a flawed one. Inferences about levels of non-compliance from data on underpayment overstate the problem where workers are earning less legitimately. But they also understate figures as ASHE is a one per cent sample of Pay-As-You-Earn income tax schemes and will miss workers in the informal economy.
Any other complexities?
It is worth saying that, on the raw data, the number of workers paid less than £7.20 is actually much higher than in today’s release - at 480,000 (2.0 per cent, or 30 per cent of coverage). ONS has corrected it to reflect a technical issue - namely that the ASHE survey collected information using a pay reference period of 13 April 2016, just two weeks after the introduction of the NLW. Where employees had a pay reference period starting before 1 April (for example, they were paid monthly), employers were not legally required to increase their pay from the old NMW to the new NLW until the first full pay period after the introduction of the NLW. ONS’ methodology therefore excludes some of those actually paid between £6.70 and £7.20.
We think this is reasonable, though there is a risk it may have removed a number of cases that do reflect actual non-compliance.
So what do we know?
Numbers paid less than the minimum for workers aged 25 and over increased from April 2015 to April 2016.
What don’t we know?
How much of the increase is because we are now measuring at introduction compared with six months into cycle, or how much is higher non-compliance with the NLW.
The main message for policy-makers is twofold.
First, the need for follow-up research to check the extent of underpayment levels over time.
Second, the need for continued strong enforcement from HMRC and regular communication to workers and employers, especially in April when the rates change.
1 comment
Comment by Panda Waddup posted on
Our removlas company and being paying £10 per h (outisde of London) for over 2 years, I belive living wage should be comulsory and people currently paying below the national minimum wage should be heavily fined.
That said, a lot of business would need more cash to pay people more, this should be encouraged by tax breaks and better gouvernment support.
Trickle down economics doesn't seem to work, we as a nation should try the other way.
I have written a piece in furtejr depth on my blog @ http://www.gopanda.co